With sights set on the 2018 season, let’s hand out some report cards for the 2017 campaign.
When the calendar turned over from March to April the Tampa Bay Rays had optimism. Much of the bright-eyes centered around the starting rotation. A rotation that, in addition to housing one of the games best strikeout pitchers, welcomed the return of a healthy veteran and a promising top-prospect for a full season.
This is a five-part series grading out the performances of the 2017 starting rotation.
Pitchers with fewer than 15 starts do not qualify for a grade.
Which means, despite showing flashes of brilliance in his rookie season, Jacob Faria (14) will not have a report card. Also, the on-again-off-again starter, Austin Pruitt is exempt from this list.
Grades are based on a few key numbers
ERA — FIP — BABIP — K/9 — WAR
Certainly, their are several other SABR-stats that could paint a more finite picture but I’m going to keep this fairly simple while also accounting for things that matter. However, since the game is not just about numbers, I will also go into a few of the intangibles surround the player’s performance.
ERA: It’s easy to see why this is a significant measure of performance
FIP (Fielding Independant Pitching): This is a truer measure of how a pitcher performed; removing factors out of his control, such as defensive inefficiencies.
BABIP: For the most part, a pitcher is going to hover around the .300 mark when it comes to batting average on balls in play. Trends in either direction typically provide some insight on how lucky/unlucky they might have been. Although, other factors (i.e. Ground Ball %, Hard Contact %) are certainly at play.
K/9: A general sense of how dominant a pitcher can be. However, a high K/9 is over emphasized if you can’t work deep into games. Which is where the next stat comes into play.
WAR: Almost the standard for measuring success among players now, Wins Above Replacement accounts for innings pitched and the success during those innings. Think of it as FIP with an emphasis on innings pitched.
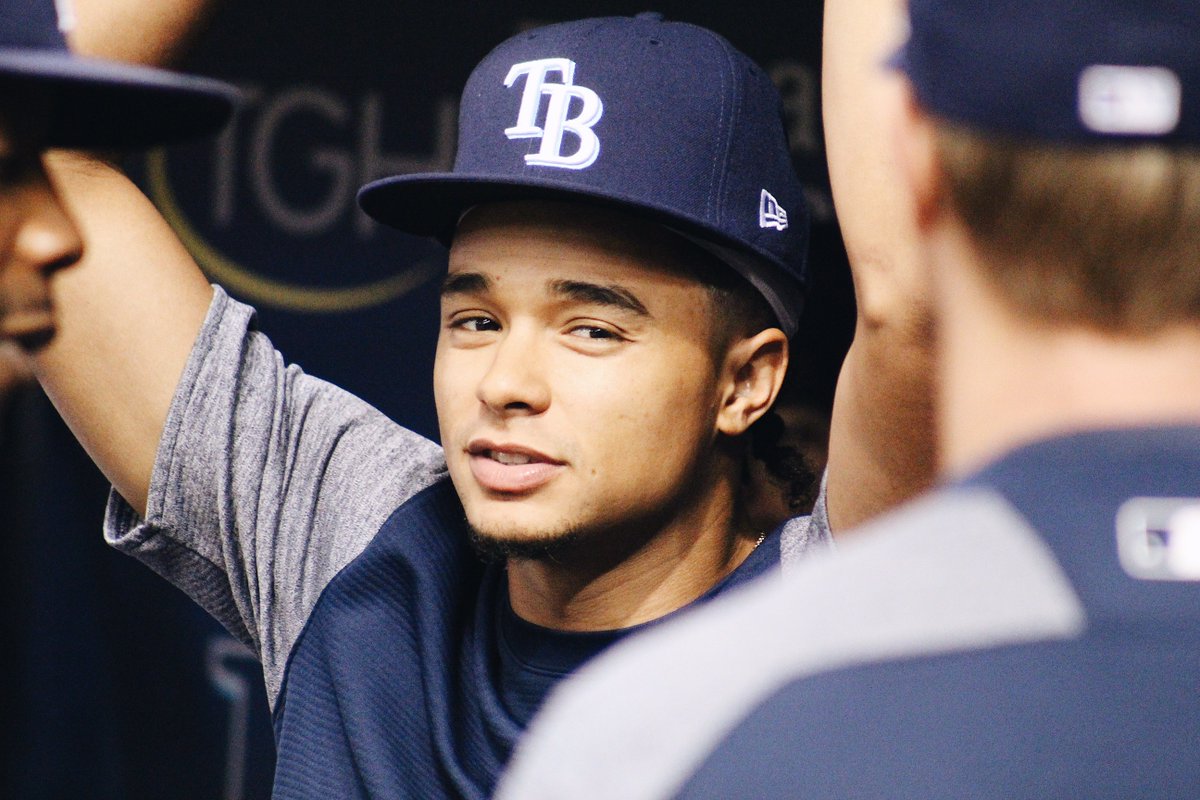
Chris Archer is first on the list. Here’s how his 2017 season looks…
Chris Archer’s 2017 Season
(10 wins, 12 loses; 249 strikeouts)
- 201.0 IP
- 34 Starts
- 4.07 ERA
- 3.40 FIP
- .325 BABIP
- 11.15 K/9
- 4.6 WAR
Notes:
Much of his success is based on durability. Perhaps the biggest reason that he is discussed as one of the games’ best – he is a work-horse. He’s eclipsed 200 innings in each of the last three seasons, and no starting pitcher has made more starts than Archer (101) over that same period of time.
His 249 strikeouts in 2017 were good for 4th in MLB but when you look into those numbers, his season was less then stellar. Of the 16 pitchers who reached the 200-K mark, only Jose Quintana (4.15) and Jeff Samardzija (4.42) had a higher ERA.
His .325 BABIP suggests that he was a bit unlucky in terms of the number of balls that got through for hits. However, he didn’t do himself any favors by posting a Hard Contact % of 39.4, sixth highest among 80+ inning pitchers. In case you’re wondering – there were 153 starting pitchers that reached the 80-inning mark. He ranks in the bottom-4% among his peers.
Don’t get me wrong, Archer is a better pitcher than Samardzija, however, I’m grouping him with guys like Carlos Martinez and Trevor Bauer before I lump him into the class of Corey Kluber and Max Scherzer.
Depending on your definition of the term, Archer has the tools to be a true ‘ace’ in this league but he has areas to improve upon. Until his numbers start to line-up more closely with baseball’s elite, I’ve got him as an above average pitcher with untapped potential.
2017 Overall Grade: B-


